What is Google Analytics?
Google Analytics is a piece of software that collects website data and analyses user behaviour.
GA (short for Google Analytics) can help you to get a better understanding of your website visitors.
Google Analytics reports can answer these essential Real Estate questions:
- Do I have more potential Sellers or Buyers?
- Which page is the most popular?
- How people find my website?
- Who are my visitors?
- How much time do people spend on my website?
How does Google Analytics work?
A small piece of code at the back end of the website does all the heavy lifting for you.
Every time you load website pages GA fires and sends data to its servers. Then Google slice and dice this data and give it back in the form of reports.
If you don’t have Google Analytics installed, here’s a solid guide on how to do it.
On the screenshot below you can see an example of a standard Google Analytics report. It is the only one out of 100+ standard reports in Google Analytics.
Note:
The platform is built for any business of any size, for this reason, it has many features that you don’t really need in Real Estate.
The platform might seem a little intimidating at first for a new user. Don’t get discouraged, you just need to know what to look for.
In this blog, I’ll show you 8 crucial reports and metrics attached to them that you need to focus on in the Real Estate business.
1. Source and Medium report
This report answers the most crucial question for your business: How do people find your website online?
On the left you can see how to get this report view, within the report there are 3 metrics you need to focus on:
Source/medium – names of traffic sources
There are many different sources of how you can get websites visitors, let’s take a look at some of them:
- Google/organic – people find you through google search.
- Direct/(none) – people typed the website URL in the browser or have your website saved in bookmarks. It shows people know you. High number of direct visits might indicate of a good brand.
- Google/CPC – Google AdWords traffic. Measure how many people came from your google paid ads. Don’t forget to check for how long people stayed on your website.
- t.co/referral – referral means that people came from another website, in this example, t.co is an app. It’s a very good sign when someone shares your content.
Sessions – number of website visits. At the top, you can see the trend over time.
Avg. Session Duration – how much time visitors spend on your website. Usually, you want users to stay on your website for at least 1 minute, especially if you write blogs.
See what source brings users who spend the most time on your website.
2. Site content report
This report shows you what pages are the most popular on your website.
Essentially it answers the question: How people use my website?
On the screenshot below I highlighted only two metrics you should focus on:
- Pageviews – Find what pages people visit the most. Do you have separate Buy, Sell or maybe Commercial property pages? Check how many people visit them and you will know what people are looking for. Does it align with your business goals? If not it’s time to change your marketing strategy.
- Avg. Time on Page. – You want people to spend more time on your blog pages and less time on a home page.
3. Demographics report
This report tells you who visits your website.
Learn more about your website visitors and tailor content for them.
Is it 25-34-year-old first-time buyers or 45-54 investors?
Combine your demographic data with other reports and tailor your new marketing message based on it.
Google Analytics doesn’t attach demographic data to individual website users for obvious privacy reasons. Demographics data is aggregated and shown for a 20-30% sample of total visitors. Which still gives you an overall picture.
Note: By default Demographics data isn’t available in Google Analytics, you will need to turn this feature on. It can take a couple of days before GA will show you the first demographics report. Here is a quick guide on how to do it (super simple).
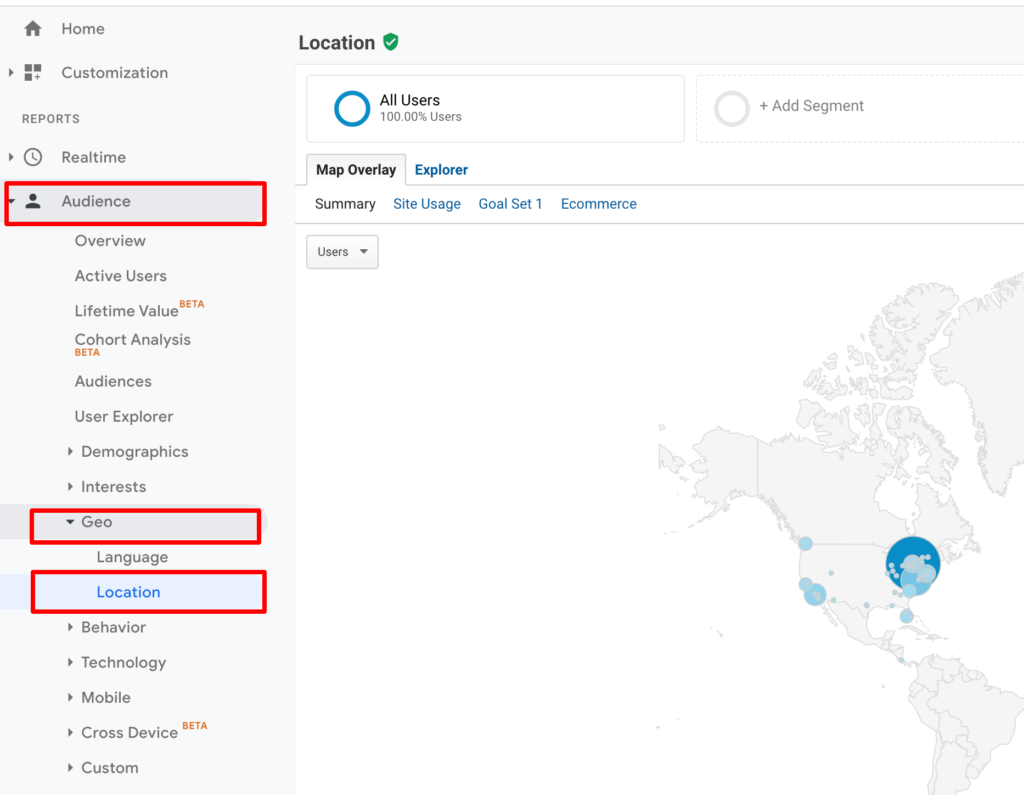
4. Location report

Yes! This is exactly what you think. You can see where users are located when they browse your website.
Location data is quite accurate.
A portion of overall traffic will be “not set” (which means Google Analytics wasn’t able to identify the location), but usually no more than 10% of the total.

You can break down website visits by country, city, continent or subcontinent. Usually, the city dimension makes the most sense for real estate professionals.
The approach is the same as for other standard reports. See how many users coming from certain regions and compare engagement. For engagement, you can take a look at either Average visit duration or Pages/Session metrics.
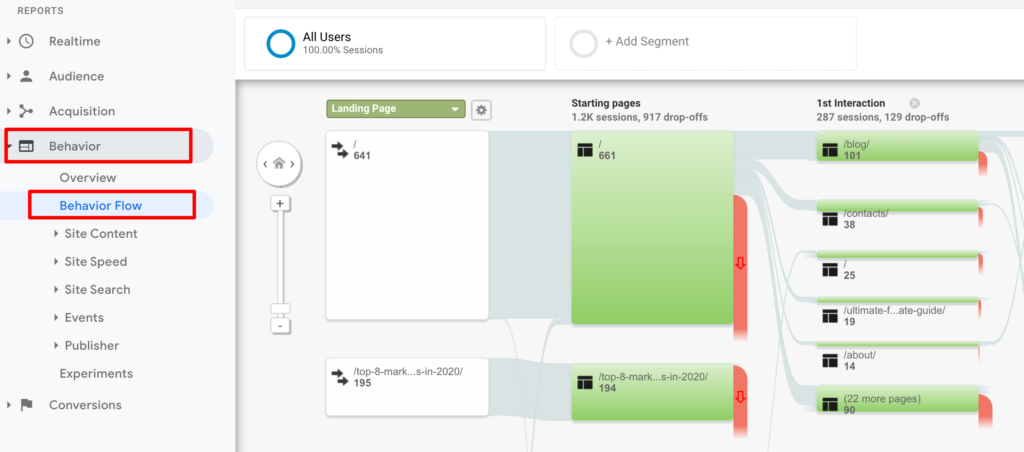
5. Behaviour flow

One of my favourite sections in Google Analytics.
The behaviour flow report will be super helpful for real estate professionals who place a website at the core of their digital strategy.
Every website has a purpose. In real estate, your website should generate leads for you. Therefore you want users to take a specific path, not just visit one or two pages but ultimately take a certain action (submit a form, download a brochure).
The behaviour flow report plots different paths how people moving between pages.
Pay attention to red arrows that show how many people drop at certain pages. For some pages, it’s totally normal to be the last one, but for some, it might indicate a problem on the website.
For most real estate professionals, I suggest leading people to a “contact me page”.
All your other pages should be logically connected to the one where you want the user to take action.
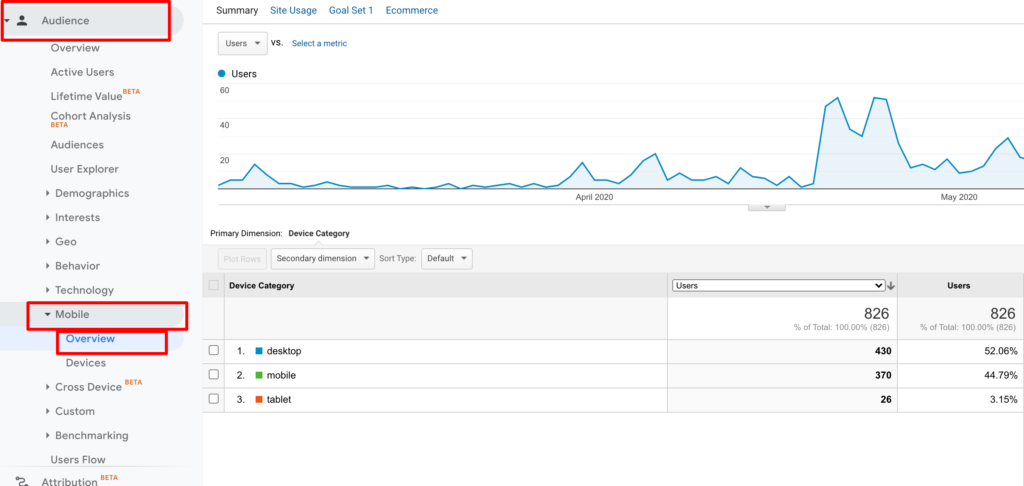
6. Desktop or Mobile visits?

What type of devices people use to access your website?
Google Analytics has a section dedicated to device types.
- Desktop
- Mobile
- Tablet
It is a crucial report because it gives us an understanding of what type of device we should optimize for.
Mobile devices
For websites where the majority of traffic coming from mobile devices, consider making a phone call button as your main Call to Action. And/Or make your contact form as simple as possible.
Don’t make mobile users scroll endless pages of text, place the most important information at the top.
Make sure your website has a mobile version.
Desktop devices
Take into consideration this data when you plan your content strategy.
For desktop heavy websites you can use more images and longer blog articles.
Insight: Despite the overall dominance of mobile devices on the internet, Real Estate websites usually receive a lot of desktop traffic. This means people are sitting at home and actually taking some time to do research. They don’t visit your website “on the go”.


![[Research] How homeowners and housebuyers choose real estate agents](https://www.desa.ninja/wp-content/uploads/2022/07/Real-Estate-Research.png)

